Documenting test architecture: Part 2 – There is a Right Way!
Alright, ladies and gentlemen! In the previous blog post, I described my recent challenge: the absence of a common approach in documenting test architecture and the potential solution to this challenge. Today, let’s take some practical steps and try to solve at least a part of the challenge using the C4 model + Structurizr bundle.
Documenting test architecture: Part 1 – Is there a right way?
Documenting test architecture: Part 3 – There’s even a better way to draw your framework
Prerequisites or Show me what you got!
In order to create a diagram, we first need to describe our existing situation, including the type of project we have, understand the testing process, and identify the main participants. For the sake of this experiment, let’s assume the following:
- The application under test: a microservice written in Kotlin + Spring Boot (but the tech stack doesn’t really matter for now). The microservice writes data to and reads it from the PostgreSQL database.
- The actors:
- a software developer that develops the microservice;
- a QA engineer that is responsible for its functional testing.
- Their team has set up a continuous testing process:
- Jenkins is used as a CI/CD system, where test jobs are also executed.
- Test automation framework handles the microservice’s functional acceptance and E2E tests. It’s written in the same Kotlin language and utilizes the Kotest framework and RestAssured.
- Results of test executions are collected in the reporting system that can generate different dashboards and insights from them.
- And finally, email and messenger integrations send notifications to the team about new builds and test runs.
Of course, it’s a high-level overview of the testing process without specific implementation details. They will follow later when needed. However, doesn’t the aforementioned remind you of the first level of abstraction from the C4 model, which is the system context? It certainly does for me. So, let’s proceed and try to draw it using the Structurizr tool.
Spinning Structurizr Up
As mentioned in the previous article, Structurizr is a set of tools for visualising textual DSL descriptions of software architecture. The gentleman’s kit we need to draw a visual representation of our test architecture is the following:
- A text editor of your choice. It will be used for writing the DSL model. For a better experience, I decided to use Visual Studio Code with the “Structurizr DSL syntax highlighting” plugin. But you are free to use any editor, even Notepad;
- The workspace.dsl file. Here we’ll be describing the DSL of our test process/architecture and later feed this file to Structurizr for rendering;
- An instance of Structurizr. There’re several ways how the tool can be installed: Lite, on-premises or the cloud version. I went for the Structurizr Lite deployed on my local machine via Docker, as the fastest and the most convenient option. Further examples will be based on this version of the tool.
Making Stricturizr Lite up and running with Docker is pretty straightforward if we follow the official guide. Assuming you have Docker installed on your machine, let’s start by pulling the latest Structurizr image:
docker pull structurizr/liteNext, we need to create a local folder where our workspace files will be stored. Let’s assume, that the folder is named structurizrWorkspaces.
Now, within the mentioned local folder, we need to create the workspace.dsl file and add our initial DSL content to it. This is required, otherwise, Structurizr will complain that there’s no workspace defined).
Let’s paste the following DSL and save the file:
workspace {
   model {
       qaEngineer = person "QA Engineer"
       applicationUnderTest = softwaresystem "Application Under Test" "Microservice: Kotlin, Spring Boot"

       qaEngineer -> applicationUnderTest "performs testing activities"
   }
   views {
       systemlandscape "SystemLandscape" {
           include *
           autoLayout lr
       }
   }
}
As you can see, here I’ve described an extremely simple model where a QA engineer tests an application under test (microservice). Don’t worry if you don’t understand other keywords and naming at the moment. We’ll delve into those details later.
Lastly, let’s run the Structurizr Docker container. However, don’t forget to map the port inside the container to your local port (using the -p flag), as well as do the same for the folders (using the -v flag):
docker run -it --rm -p 8080:8080 -v /Users/yourUser/structurizrWorkspaces:/usr/local/structurizr structurizr/liteIf everything goes well, we should see the container spinning up. After a few seconds, the Structurizr UI should be accessible in our browser using the http://localhost:8080 address:
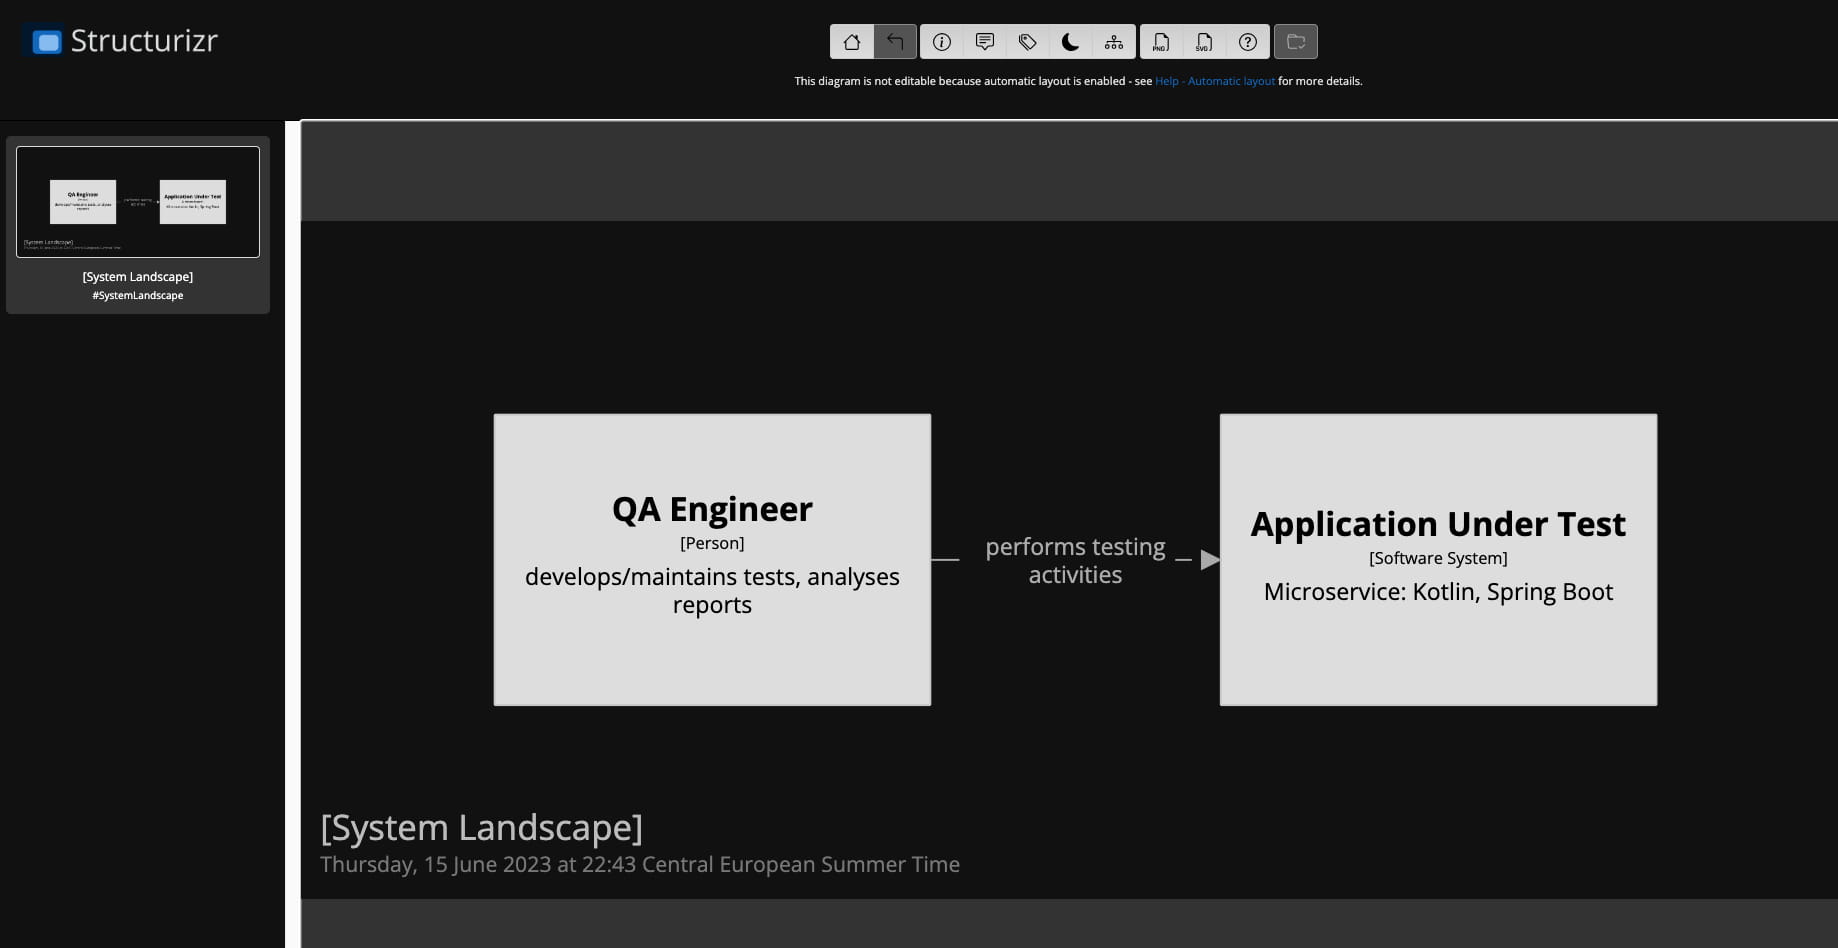
Voila! We’ve just created our first diagram of the testing process!
Speaking of the… DSL grammar
As you may have noticed in the previous section, our first DSL snippet had a specific structure. The top-level workspace keyword was used to wrap literally everything else. Inside it, there were 2 fundamental concepts of the C4 DSL described:
In our example, the model describes a person named “QA Engineer” and the softwaresystem called “Application Under Test”. The QA Engineer performs various testing activities with it and validates that the application under test works well. Their relationship is defined in the DSL as qaEngineer -> applicationUnderTest with the description “performs testing activities”. More info about relationships can be found here.
So, after describing the model, I defined the first top-level view which is the system landscape diagram. My intention was to show a high-level overview of everything without focusing on a particular testing system’s internals.
The include keyword with the asterisk * is used to include relationships and elements, depending on the view where it’s used. In the case of the system landscape view, it includes all people and software systems that have been described.
And finally, the autoLayout keyword instructs Structurizr to automatically layout elements on the view (in our example, from left to right). You can use different autolayouts if you want, but I decided to disable autolayout after adding all elements to the diagram. The reason was that multiple relationships resulted in many crossing lines on the diagram, and I wanted to reorganise it a bit. Disabling autolayout allows you to drag & drop elements in the Structurizr UI and arrange them in the way you want.
Expanding the system landscape
I think it’s time to move on and add all the remaining participants of our continuous testing process, as described at the beginning of this article, to the system landscape diagram:
model {
   qaEngineer = person "QA Engineer" "develops/maintains tests, analyses reports" "QA"
   developer = person "Developer" "analyses reports, troubleshoot issues" "Dev"

   applicationUnderTest = softwaresystem "Application Under Test" "Microservice: Kotlin, Spring Boot"
   serviceDatabase = softwaresystem "Database" "PostgreSQL" "Database"
   notifications = softwaresystem "Notifications" "Internal messenger, Email" "Existing System"

   group "Continuous Testing Setup" {
       ci = softwaresystem "CI/CD system" "Jenkins: triggers test pipelines, build and stores artifacts" "CI"
       testAutomationFramework = softwaresystem "Test Automation Framework" "contains autotests, CI configuration and other utilities" "Automation"
       reporting = softwaresystem "Reporting System" "test automation reports and dashboards" "Reporting"
   }

   qaEngineer -> applicationUnderTest "performs testing activities"
}
The DSL above is pretty self-explanatory. I first added the missing parts such as “Developer”, “Database” and “Notifications”. Next, I included the test automation framework, the CI system and the reporting solution. To emphasize that they’re in the same boat parts of the same setup, I combined them into the “Continuous Testing Setup” group.
New input brought the following diagram into existence:
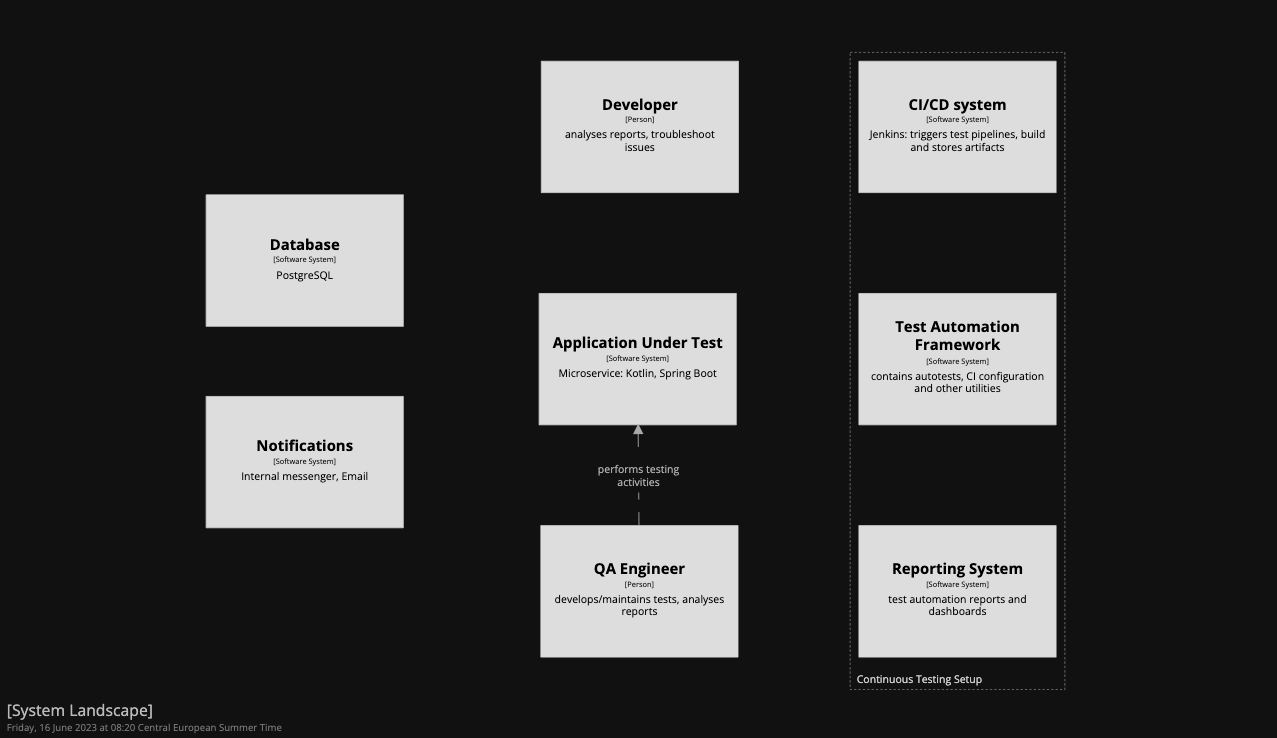
Looks better already, doesn’t it?
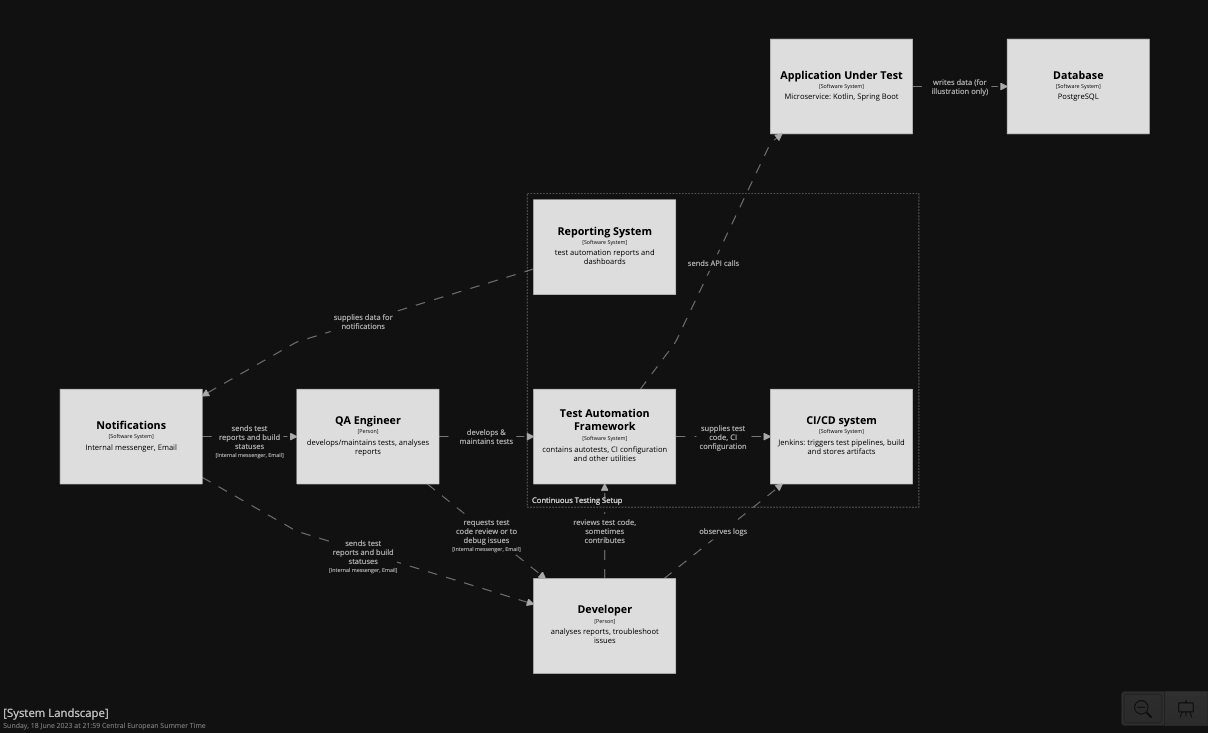
However, it’s not entirely clear what interacts with what and how, because I haven’t added any other relationships yet. Let’s fix that and bring more clarity to the diagram. The following snippet should do the work:
qaEngineer -> testAutomationFramework "develops & maintains tests"
developer -> testAutomationFramework "reviews test code, sometimes contributes"
testAutomationFramework -> applicationUnderTest "sends API calls"
testAutomationFramework -> ci "supplies test code, CI configuration"
reporting -> notifications "supplies data for notifications"
notifications -> qaEngineer "sends test reports and build statuses" "Internal messenger, Email"
notifications -> developer "sends test reports and build statuses" "Internal messenger, Email"
qaEngineer -> developer "requests test code review or to debug issues" "Internal messenger, Email"
developer -> ci "observes logs "
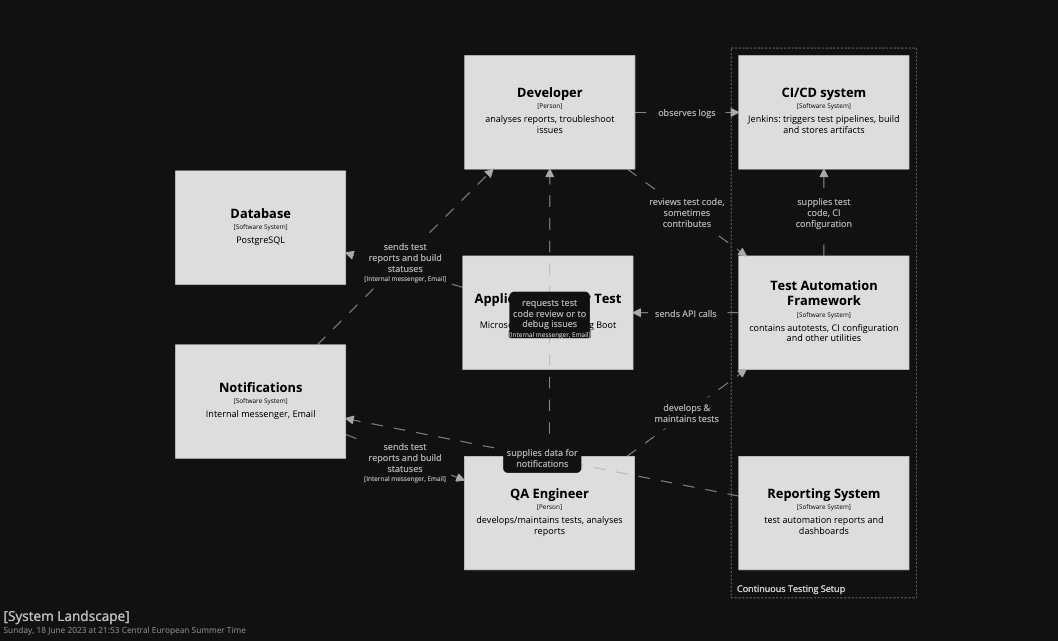
applicationUnderTest -> serviceDatabase "writes data (for illustration only)" "" "OutOfScope"Most of the relationships above speak for themselves. I removed the existing relationship between the QA Engineer and the Application Under Test and added new relationships between the Test Automation Framework, people (QA and Dev) and the Application Under Test. It makes more sense, as the testing framework now directly interacts with the application under test.
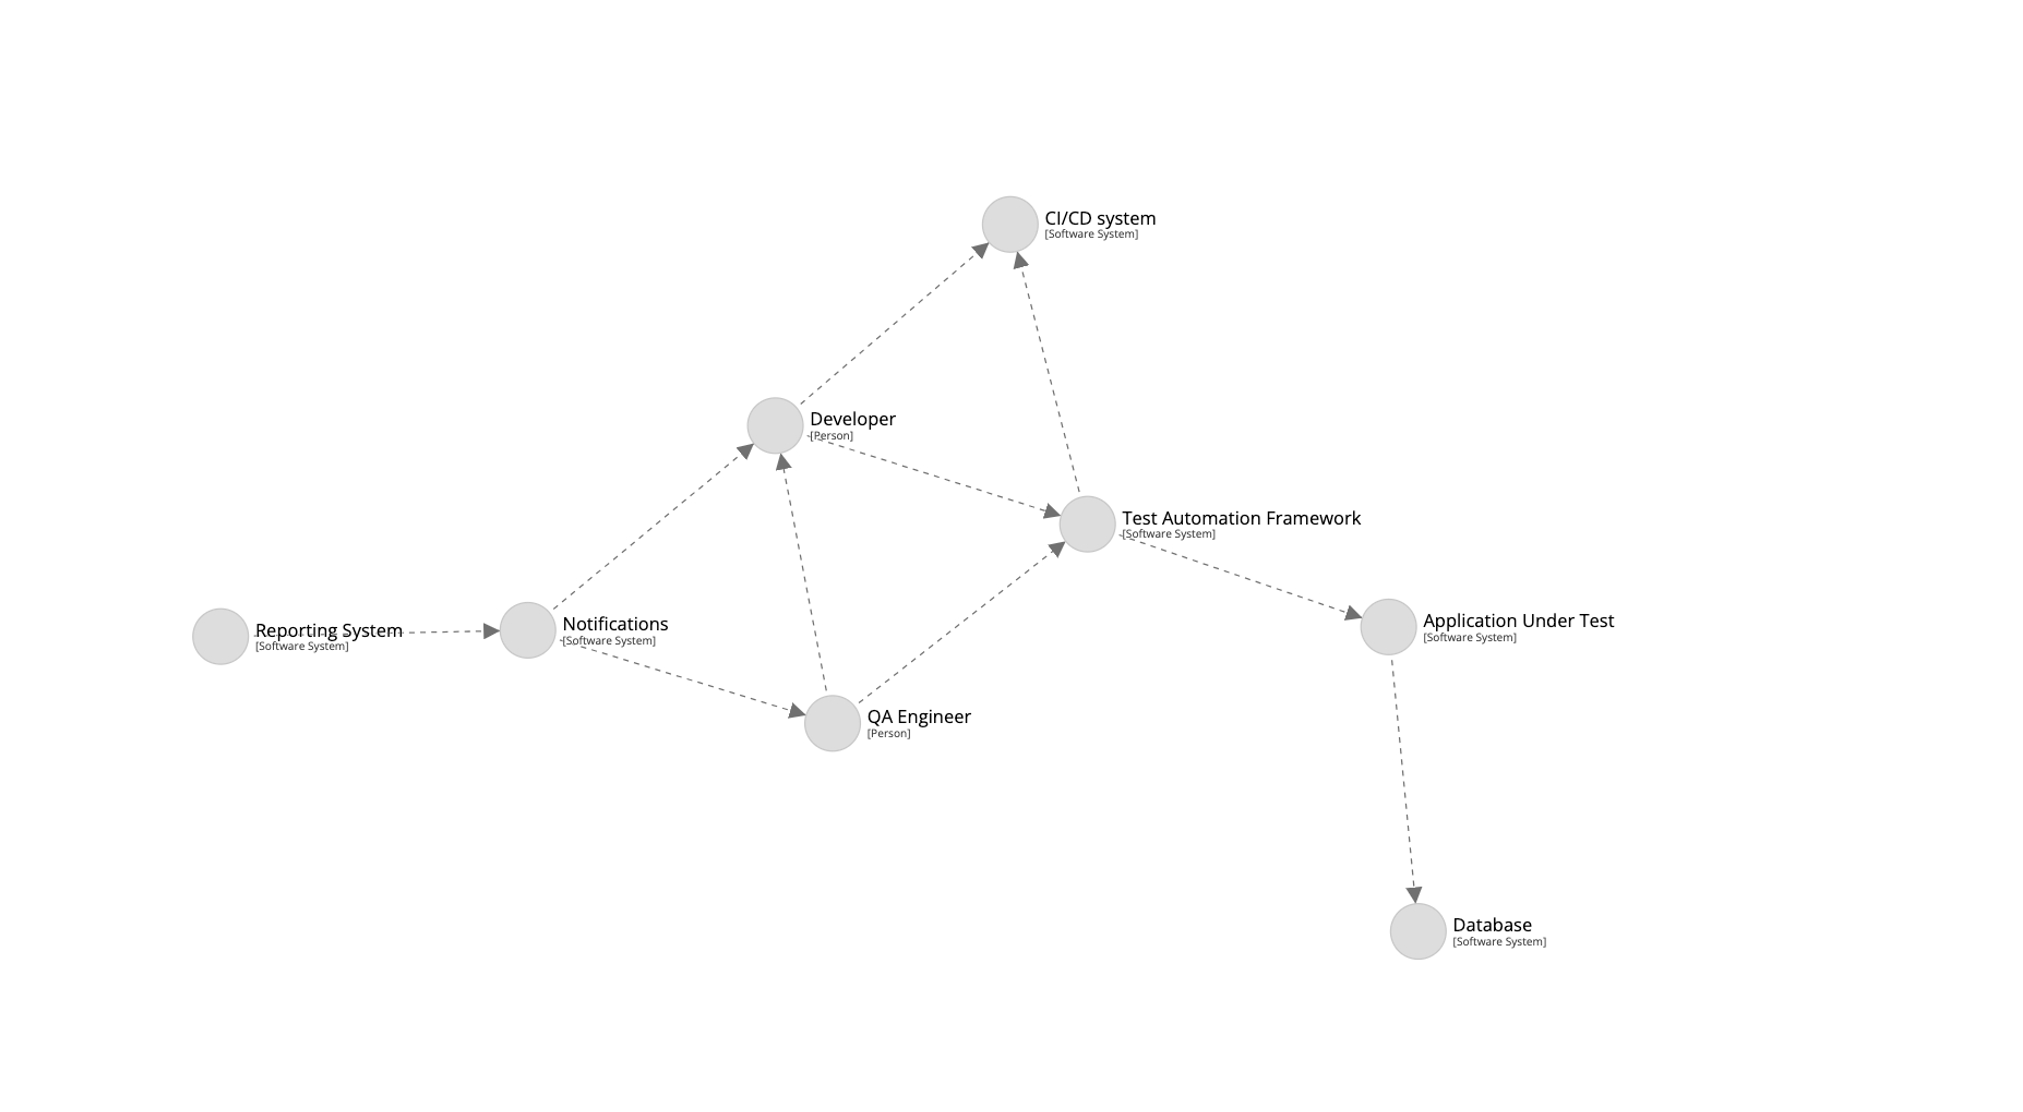
However, since the autolayout was disabled, the blocks and lines on my new diagram appear a bit messy and overlapping:
There’re 2 ways we can fix this:
1) Enable autolayout, and Structurizr will try to do its best to re-arrange everything:
It looks much better now but it’s still not exactly how I envisioned it. I would prefer to have the people placed closer to each other, as well as have the reporting and notifications positioned as neighbours.
2) Disable autolayout again and re-arrange the diagram manually:
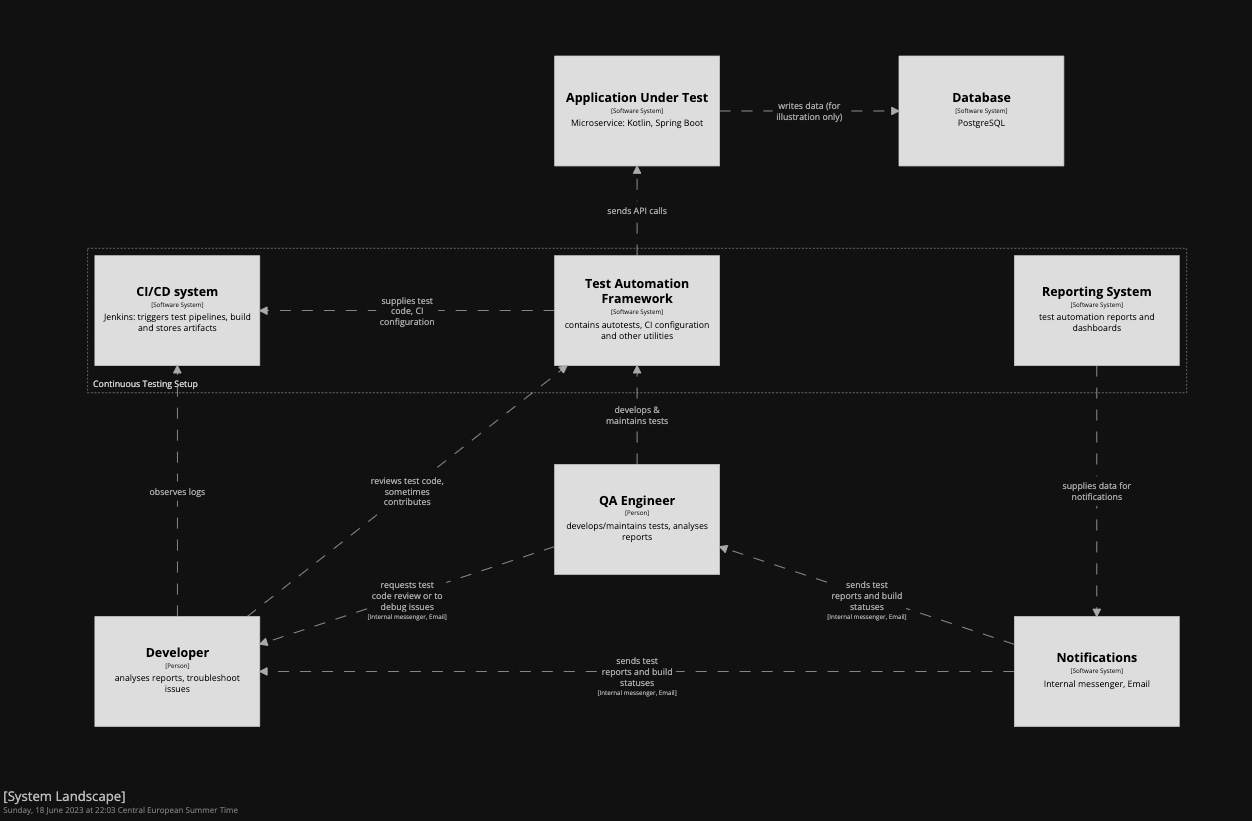
Looks much clearer to me now! However, the first thought that comes to mind after seeing such a diagram is that it is a bit boring, isn’t it? Can we make it look more engaging?
Diagramming doesn’t really have to be boring
The beauty of Structurizr is that it provides the flexibility to customize how our diagrams look and feel. You might have noticed that when defining the main participants of the continuous testing process, they were assigned short tags like “Dev”, “CI”, “Database”, “Reporting”, etc.
Using these tags, it is possible to modify the default properties of those elements and relationships and make them more visually appealing by utilizing the styles keyword. Here’s an example:
views {
    systemlandscape "SystemLandscape" {
        include *
    }

    styles {
        element "Reporting" {
            shape WebBrowser
            background #96be25
            color #ffffff
        }
        relationship "OutOfScope" {
            color #f3ff00
            dashed false
        }
        element "Automation" {
            shape Robot
            background #08427b
            color #ffffff
        }
        element "Person" {
            color #ffffff
            fontSize 22
            shape Person
        }
        element "QA" {
            background #1e81b0
        }
        element "Dev" {
            background #6c25be
        }
        element "Notifications" {
            background #999999
            color #ffffff
        }
        element "CI" {
            background #be4d25
            color #ffffff
        }
        element "Database" {
            shape Cylinder
        }
    }
}
As you can see from the example above, I changed colours and introduced different shapes for some elements. Also, the style of the relationship between the app under test and its database was adjusted, just to show that it’s out of the scope of the diagram. Here’s the final result:
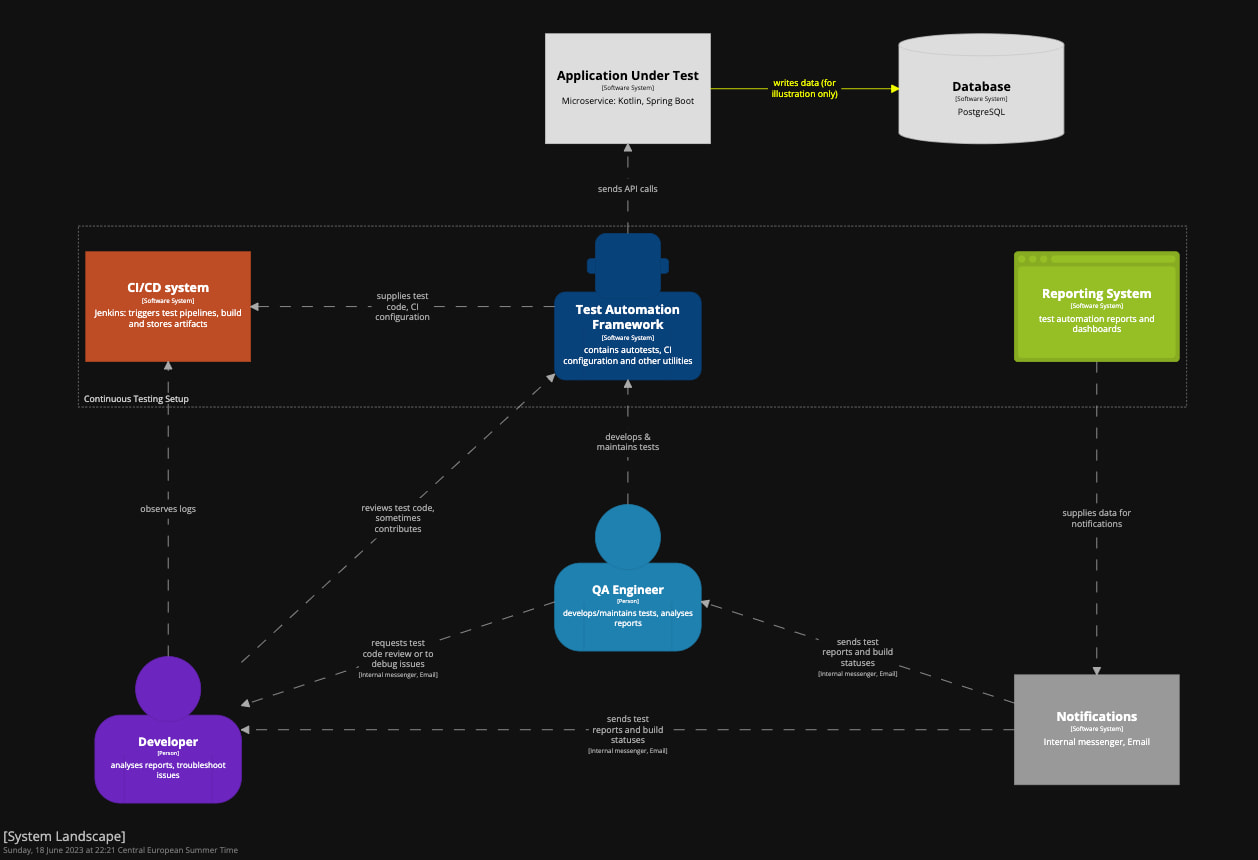
Not bad, I would say. If I were to look at such a diagram, I would definitely gain a high-level understanding of how the continuous testing setup looks like in a company. Would you?
The next set of questions now arises: How does the test automation framework work? What does it consist of? Can we leverage the power of the C4 model and Structurizr to find the answers?
I am going to answer these questions and even draw the next level of the C4 model (container diagram) in my next article of this series very soon. Be sure to stay tuned, so you don’t miss it!